
Every month, SIG tracks net lease closings across the country by tenant, sector, and cap rate, and here’s what we saw in September.
September has 968 recorded closings so far, and August’s total has been revised up to 1,250. Activity cooled in Q3, with year-to-date closings down 23% from 2025 and 8% from 2024, though still 11.5% ahead of 2023.
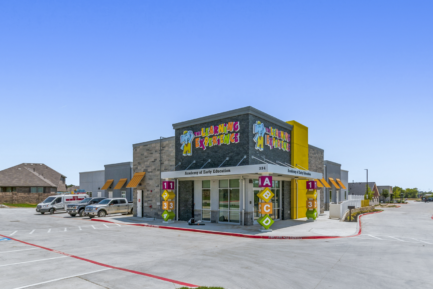
Cap rates continued to compress in most categories. Automotive tightened the most at about 33 bps, while Fast Food, our largest category by volume, came in about 17 bps. Discount Retail, Drugstore, and Early Education went the other way, with cap rates ticking up.
We’re also keeping an eye on inventory as more product comes to market. It hasn’t had a noticeable effect on pricing yet, but if the last cycle is any guide, pricing will likely start to adjust once supply reaches a certain point.
Download the full September report for the sector-by-sector breakdown.
This report is one piece of what SIG’s Developer Services team tracks every month, following pricing, buyer activity, and cap rate movement down to the tenant and submarket level. Combined with more than a decade of buyer relationships, that data helps us get new builds in front of the right buyer quickly.