
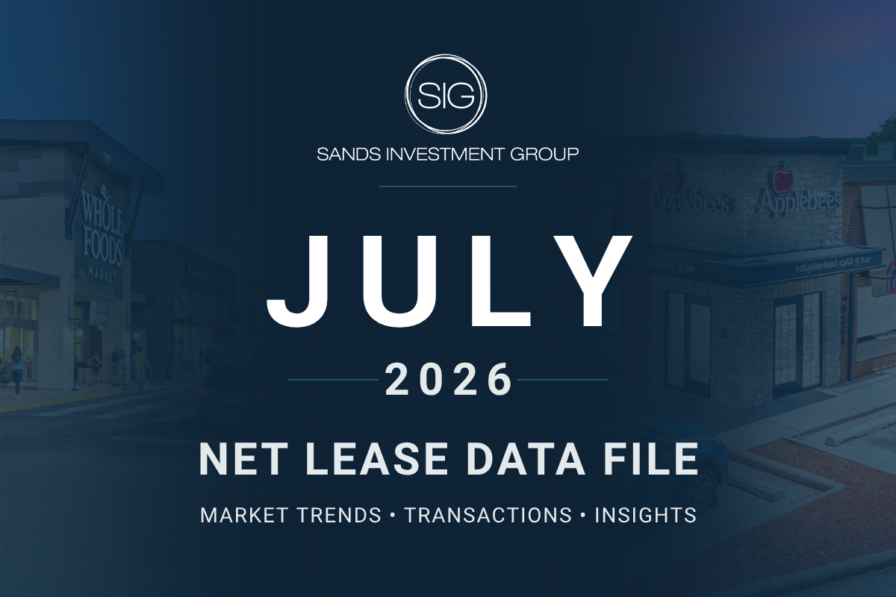
Every month, SIG tracks net lease closings across the country: by tenant, by sector, by cap rate. Here’s what July told us.
The month closed at 1,026 transactions so far, a number that will still climb as late reporting comes in, but it points to a continued slowdown during what’s usually a prime summer month. The same period last year closed at 2,671 transactions, compared with 2,179 in 2024. The 10-year Treasury sits at 4.78%, which keeps debt costly for buyers and passive investors on the sidelines, while ongoing overseas conflict continues to weigh on the buyer pool. Want the full breakdown of where cap rates and closings landed by sector? Download the complete July report.
This report is one piece of what SIG’s Developer Services team tracks every month: pricing, buyers, and net lease cap rate movement across the country, down to the tenant and submarket.
That intelligence is what gets a new build in front of the right buyer fast, backed by over a decade of relationships and execution experience.